
I had a 17 year career in retail advertising, working for the Montgomery Ward corporate headquarters in Chicago (1973-90). Every day we created visualizations that showed customers merchandise and services offered at our 400 stores and deals that were available if they shopped NOW.
I’ve carried that into my leadership of volunteer-based tutor/mentor programs, which began in 1975 while I was still working at Wards. Below are a few examples.
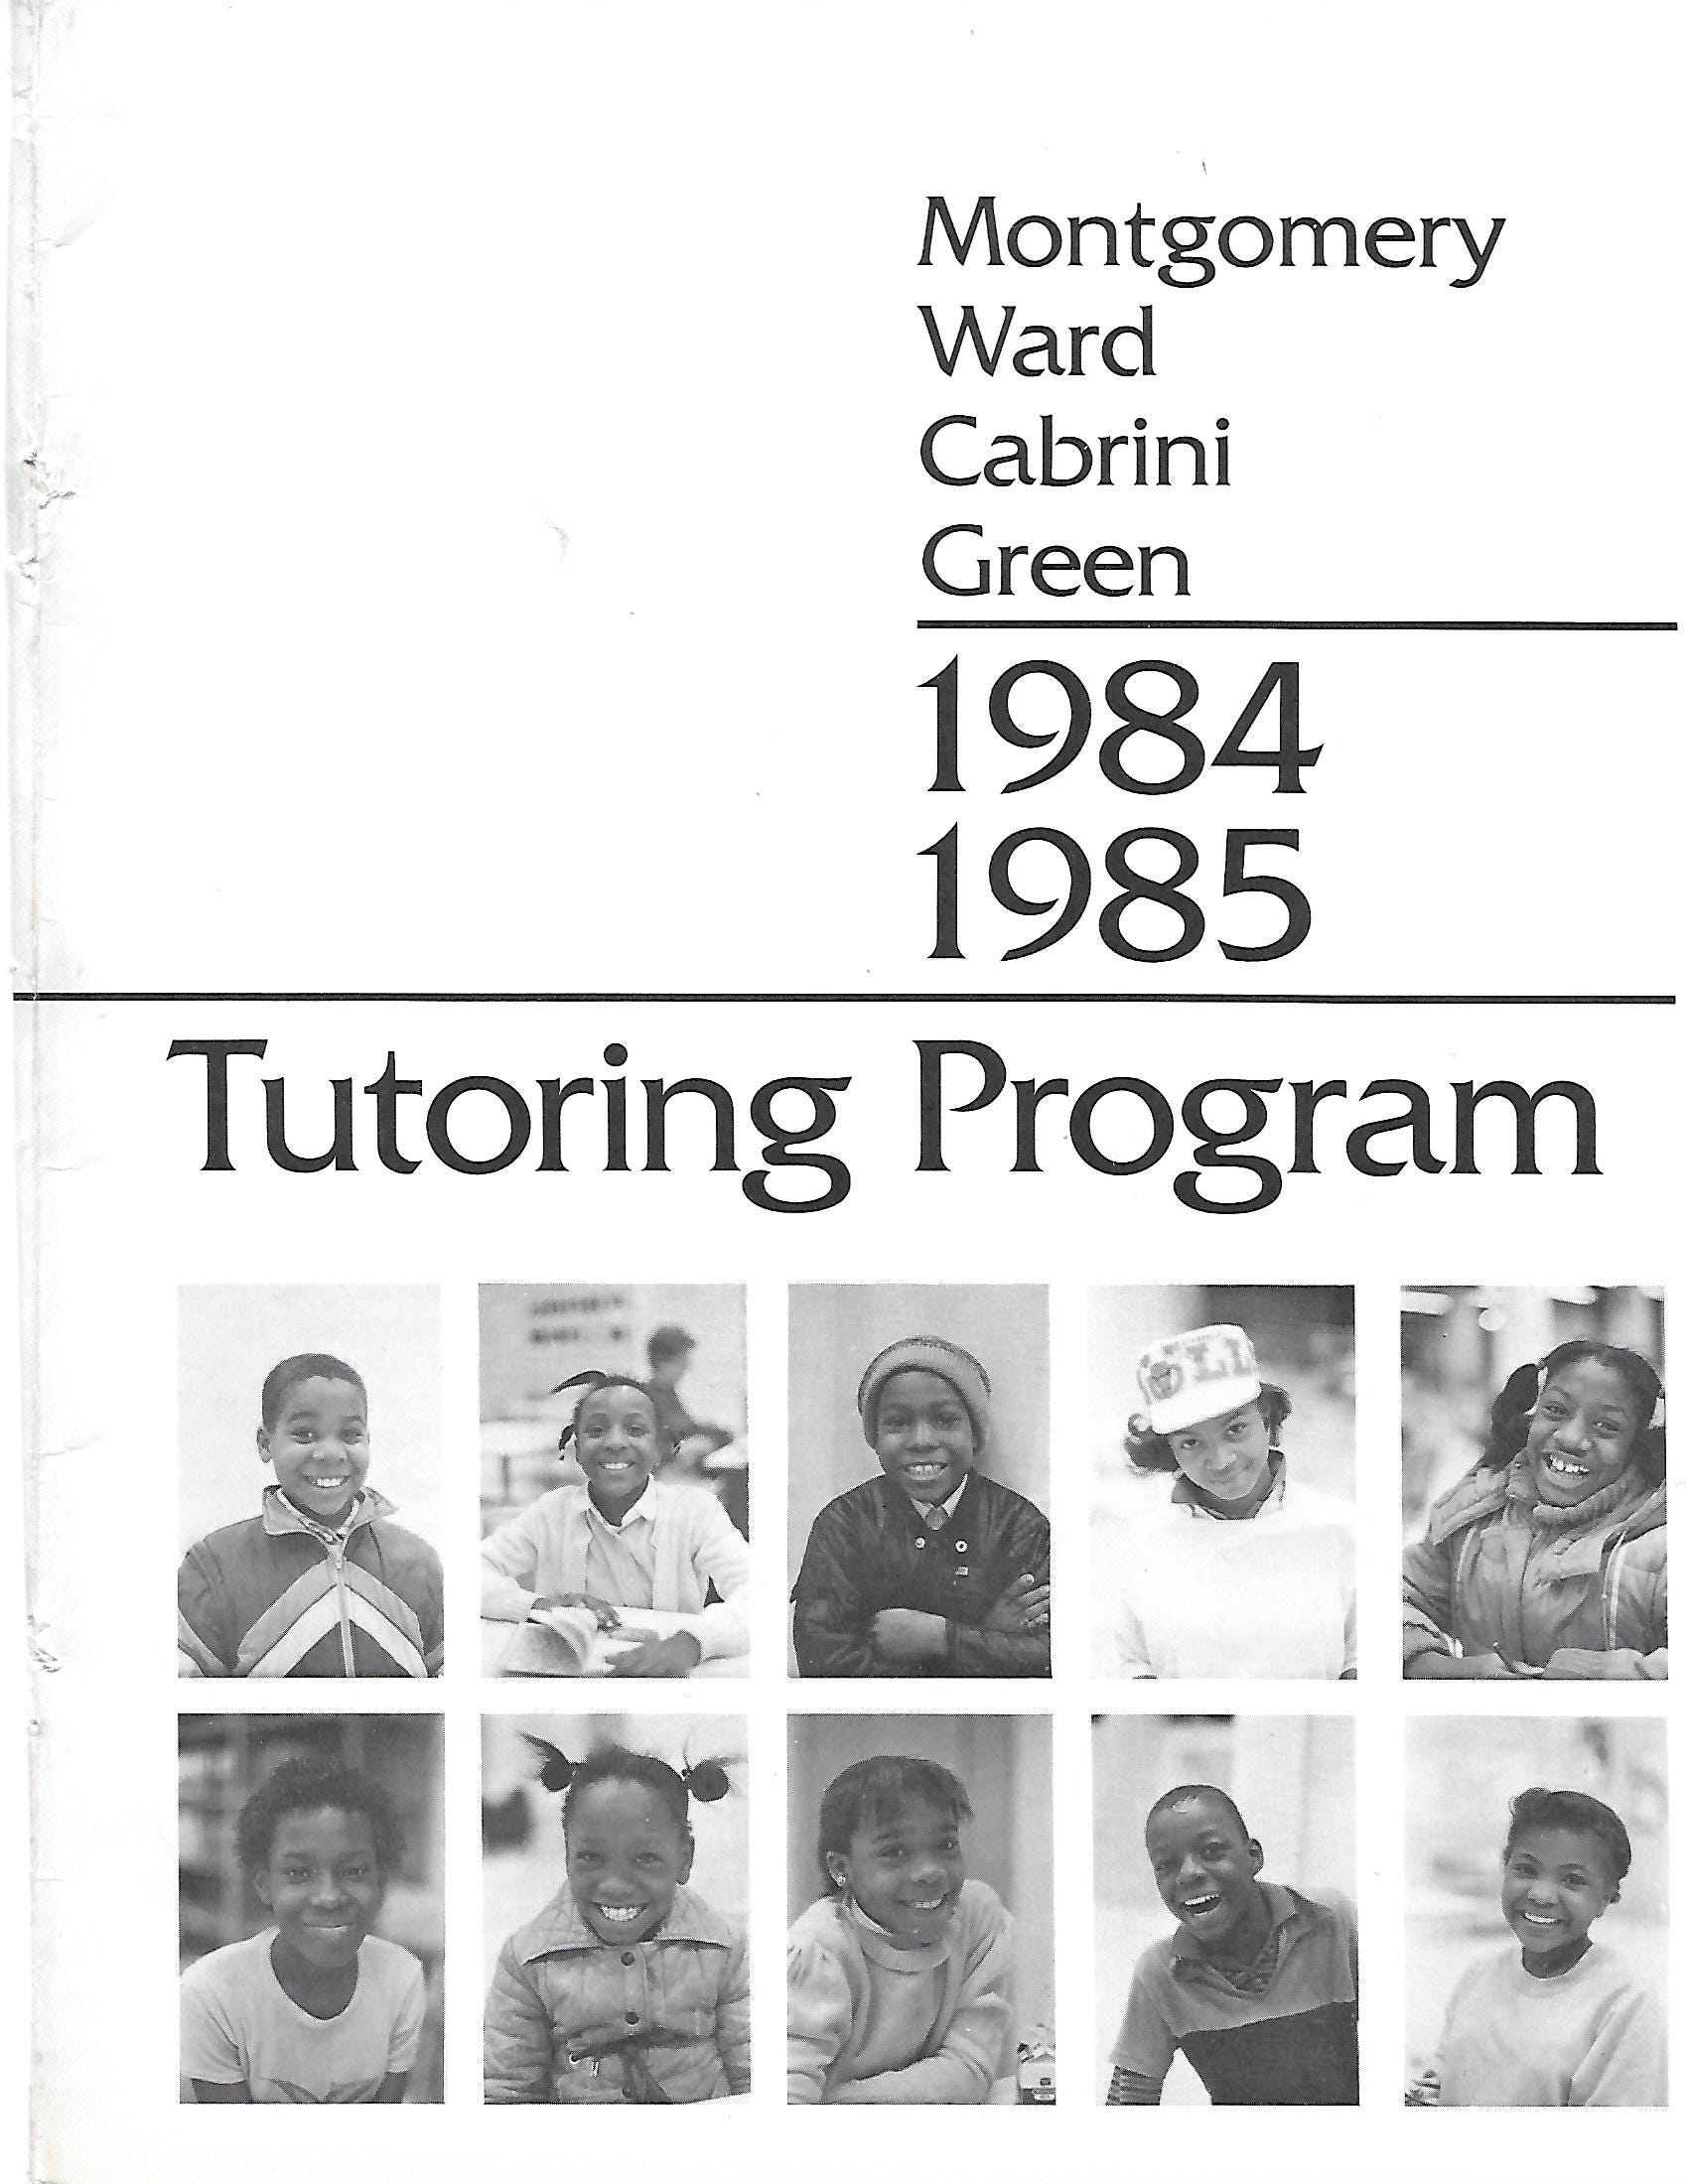
Each year from 1975 to 2010 a created a year-end report and yearbook that was a visual journey through the activities of the previous year and a call for others to support the program. Below is the cover of the 1984-85 program (see link below).
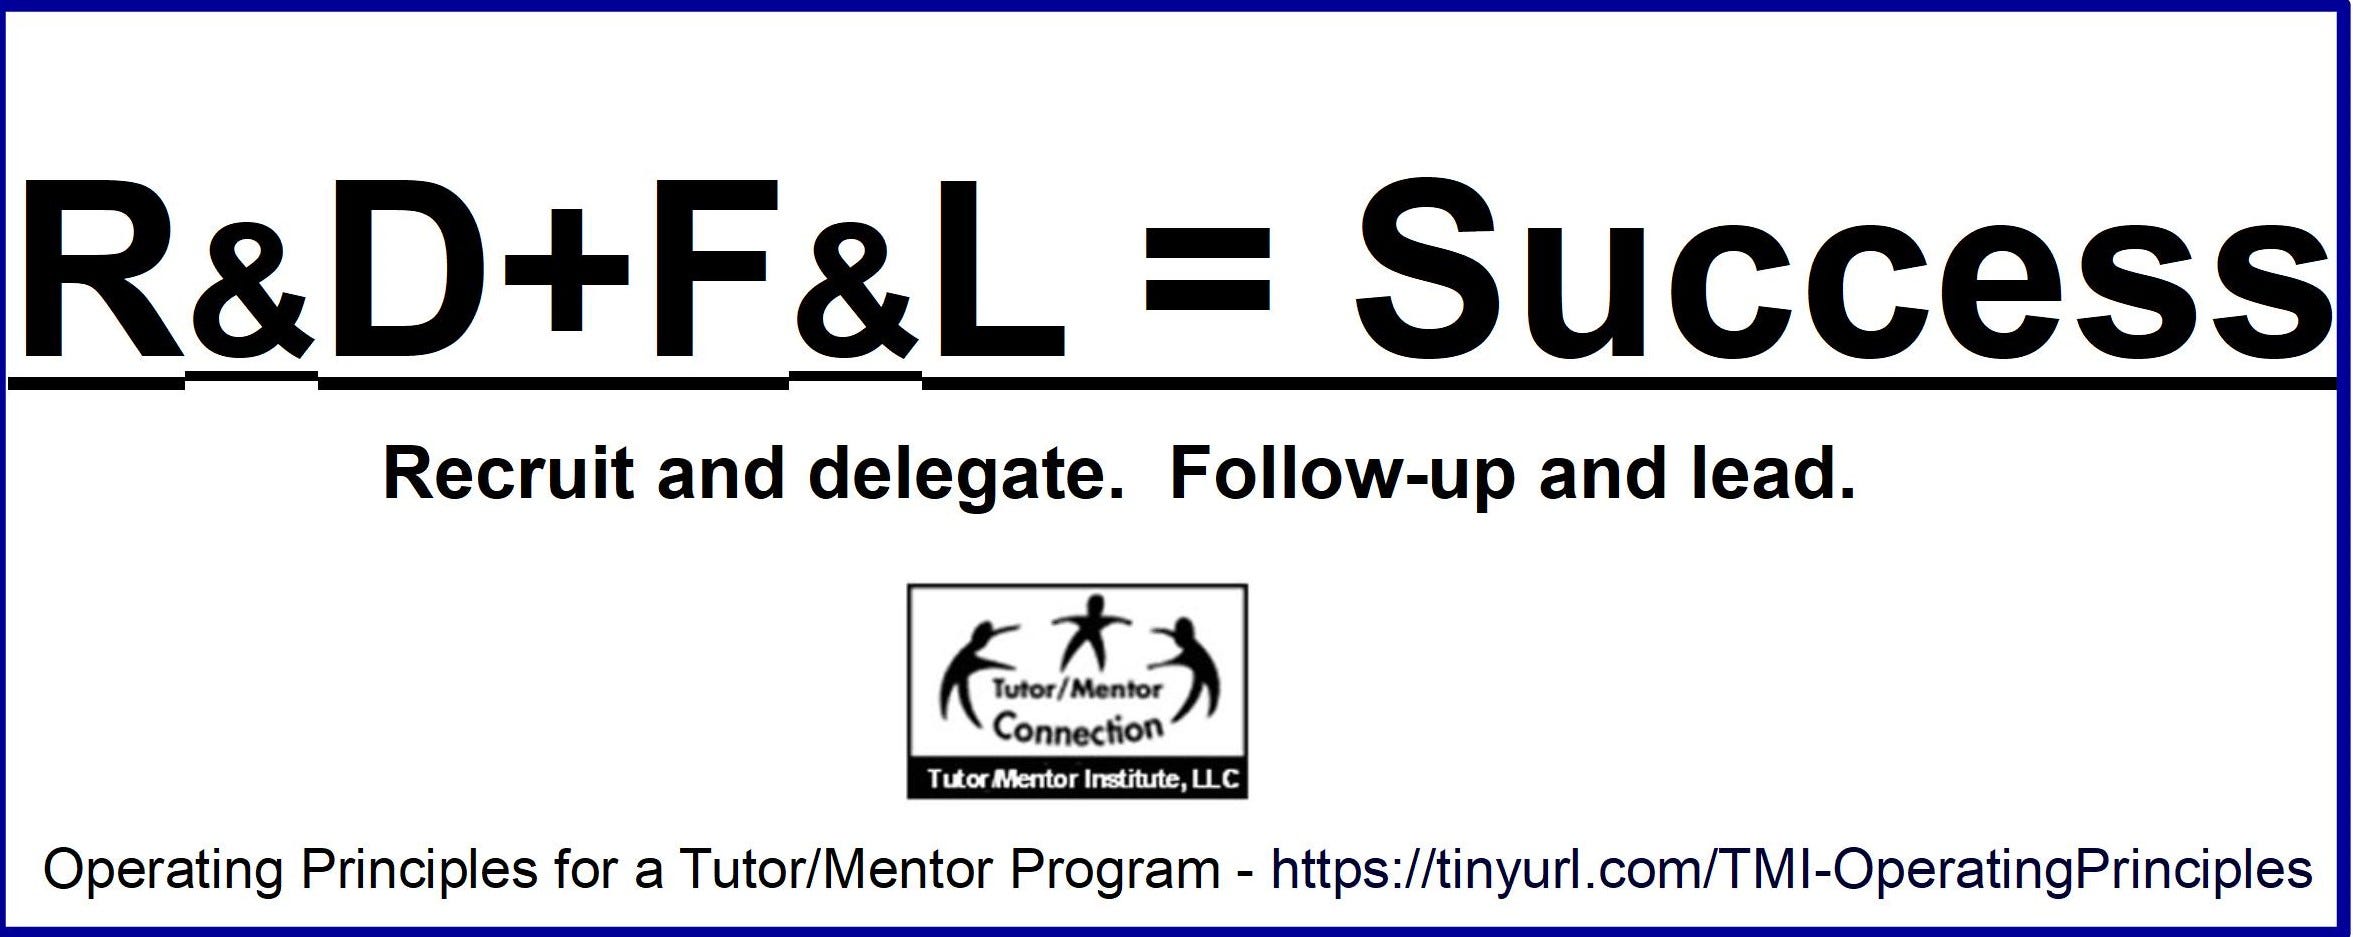
I learned that to successfully involve volunteers in leading a constantly improving program you needed to Recruit and Delegate, then Follow-up and Lead. I shared that strategy in this Operating Principles visual essay.
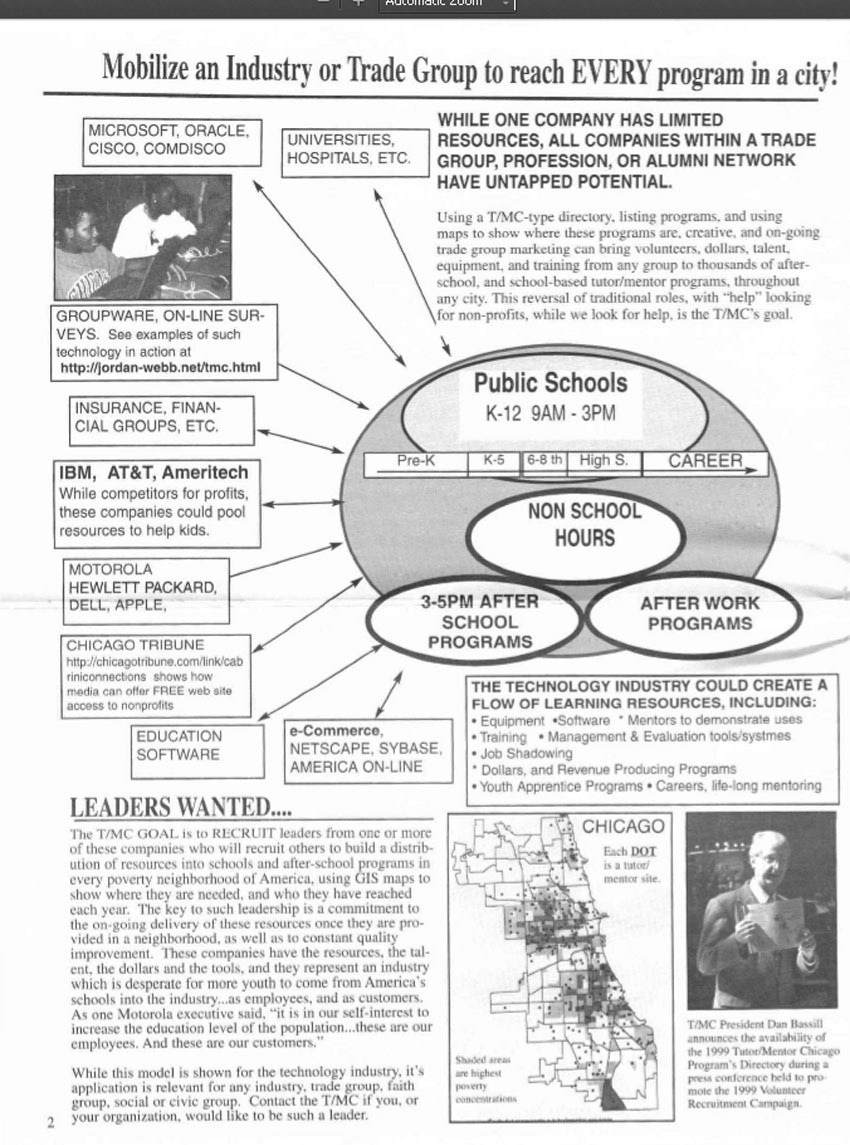
I used printed newsletters in the 1990s, then email newsletters, a website and blog articles to share visualizations of the strategies that I’d developed over my many years of leading a single program. Below is a page from the Fall 1999 T/MC Report. (see link below)
I started using cMapTools in the mid 2000s to visualize strategies and commitments needed to reach all K-12 kids living in areas of persistent poverty with well-organized, on-going, mentor-rich programs. Below is the first map of the collection.
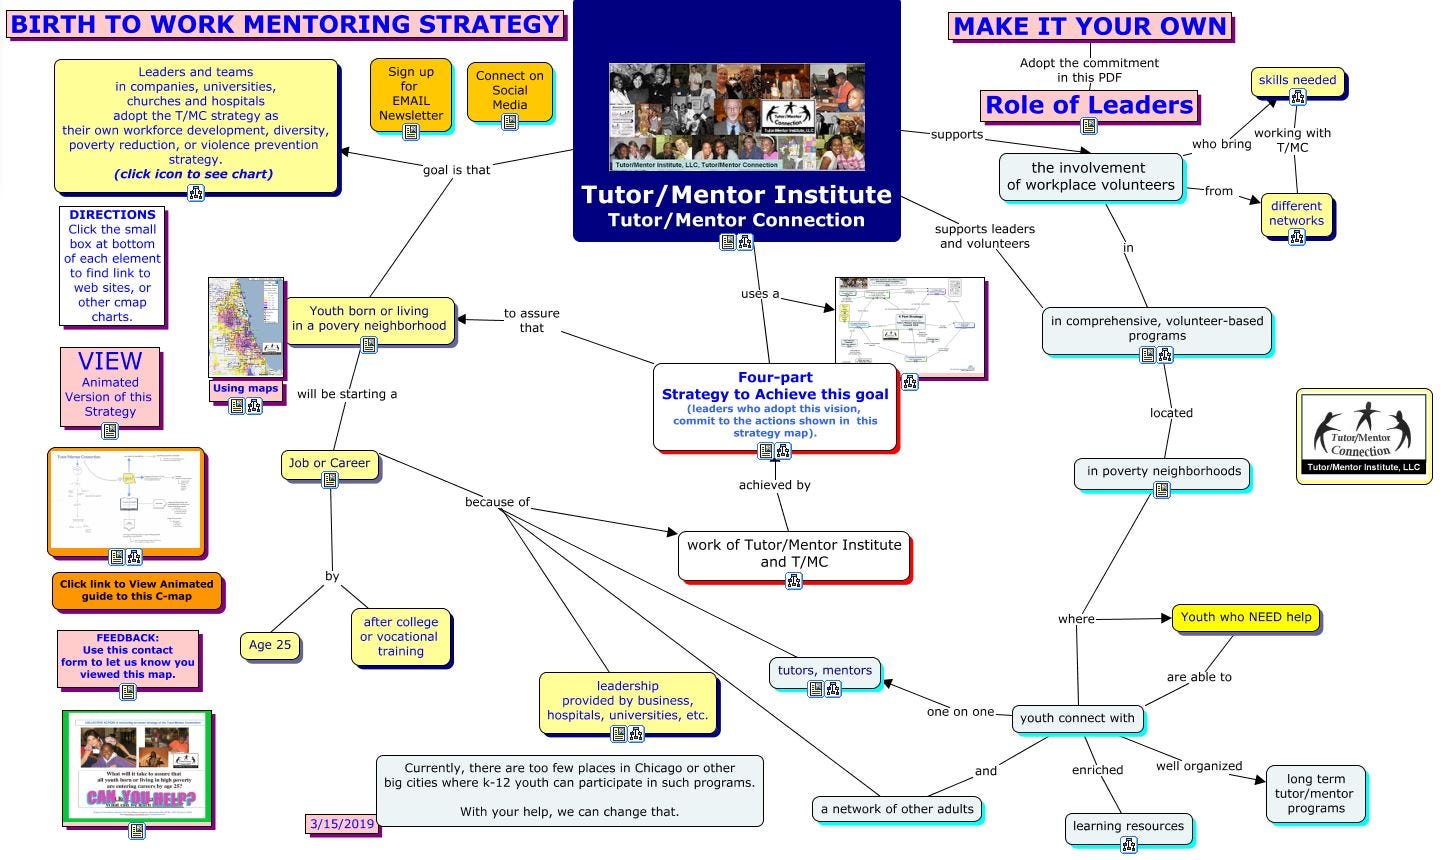
I’ve created many concept maps since then and you can find links to this one and others on this page.
When we created the Tutor/Mentor Connection in 1993 our aim was to “learn all we could about successful non-school tutoring/mentoring programs and apply that knowledge to expand the availability and enhance the effectiveness of these services to children throughout the Chicago region.” As we began using the Internet in the mid 1990s that commitment extended to the entire world.
The “learning” started with launching a survey to build a comprehensive list of volunteer-based tutor/mentor programs, and segment that into grade level served, type of program, location, and time of day the service was offered. We published this in a printed directory from 1994 to 2003. View the 1995 directory.
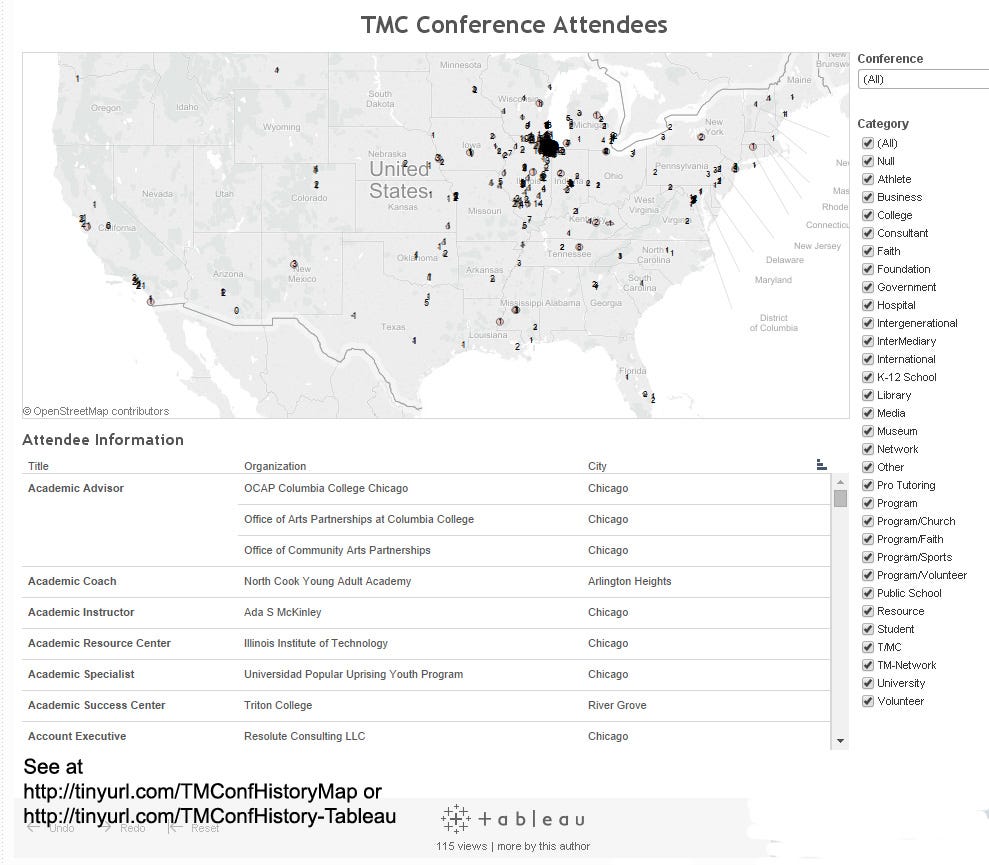
We started using the responses to the survey to build a database which we used to mail newsletters, and to send invitations for people to gather, network and share ideas in Tutor/Mentor Leadership and Networking Conferences, which I hosted every six months from May 1994 to May 2015.
Below is a map showing participants who came from all over the USA. click here
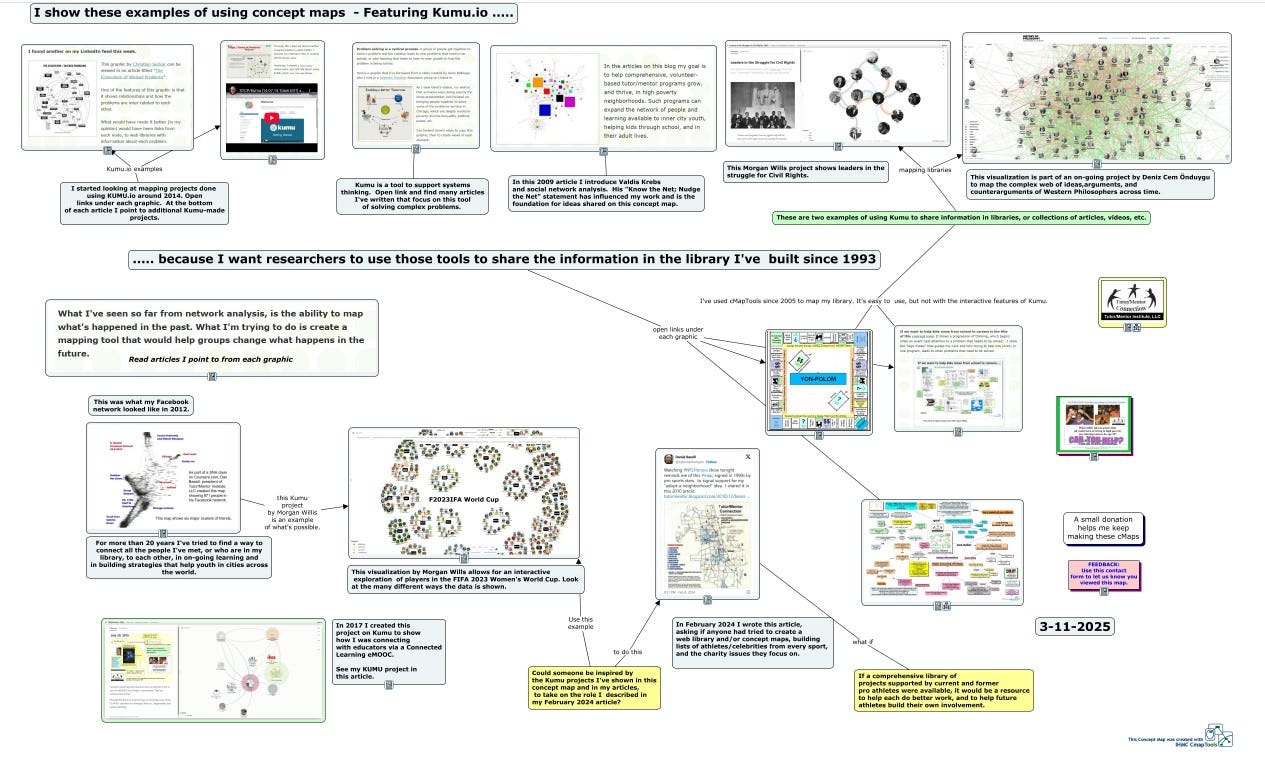
Over the past five years I’ve seen the development of powerful new network mapping tools. I’ve pointed to those in many blog articles. A few weeks ago I created the concept map shown below, which serves as a navigation tool to help people find some of those articles. It’s included in this article about “mapping participation”.
I still lead the Tutor/Mentor Connection, but since 2011 it’s been through the Tutor/Mentor Institute, LLC, which has not had any significant money or volunteer talent helping me. Much of my time is spent keeping my website updated and sharing ideas on my blogs. I hope you’ll take a look.
- You can find my newsletter archive at this link.
- You can find my 1975 to 1992 annual report archive at this link; View 1994 to 2010 annual reports at this link.
This final graphic shows work interns did between 2006 and 2015 to create their own visual interpretations of the ideas I’ve been sharing. You can view it here.
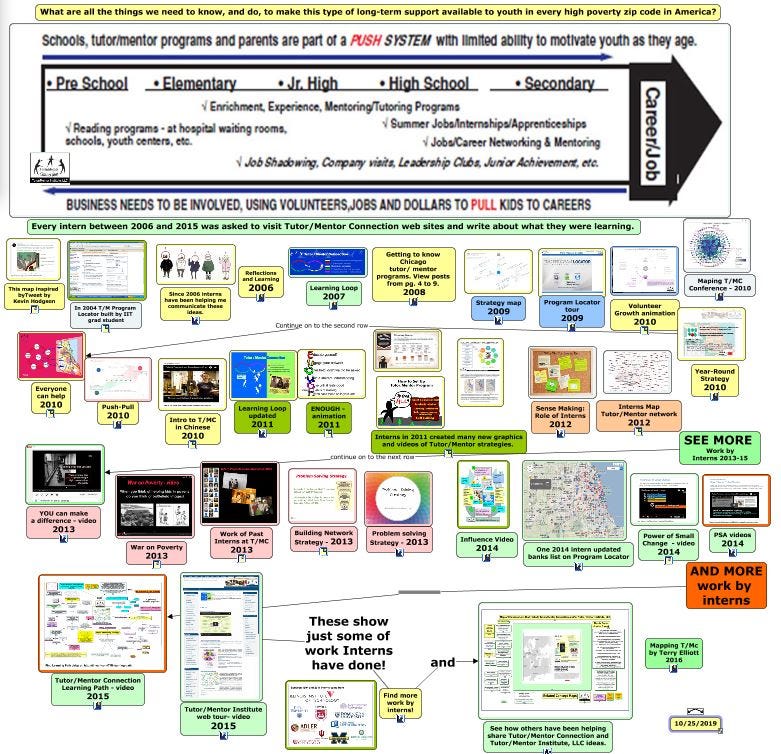
I share all of this because I want people to create and share their own versions. Too few people have ever seen my newsletters or blog articles, thus my influence on leaders and policy-makers in tiny.
The USA is still dealing with issues of persistent poverty, as well as a need for mentoring connections that reach youth across all income levels. I’d love to have one, or more, universities create a study program that uses my archives as a resource, and creates a new generation of networked leaders. At some point in the future they could be creating their own articles like this, showing work they’ve done over a 30 year period or longer. Read this “Tipping Point” article.
Thanks for reading. I look forward to hearing from you and seeing how you share similar ideas.
Since I wrote this in August 2025 students in an Information Visualization class at Indiana University have created three new projects, that visualize participation in the Tutor/Mentor Leadership and Networking Conferences that I hosted in Chicago between May 1994 and May 2015. I point to them with blog articles and from this page on my website. https://tutormentorexchange.net/mapping-participation